Edit Tree
The Edit Tree card controls how the tree is structured and displayed in the graph — it doesn't change the underlying fitted model, only what you see.
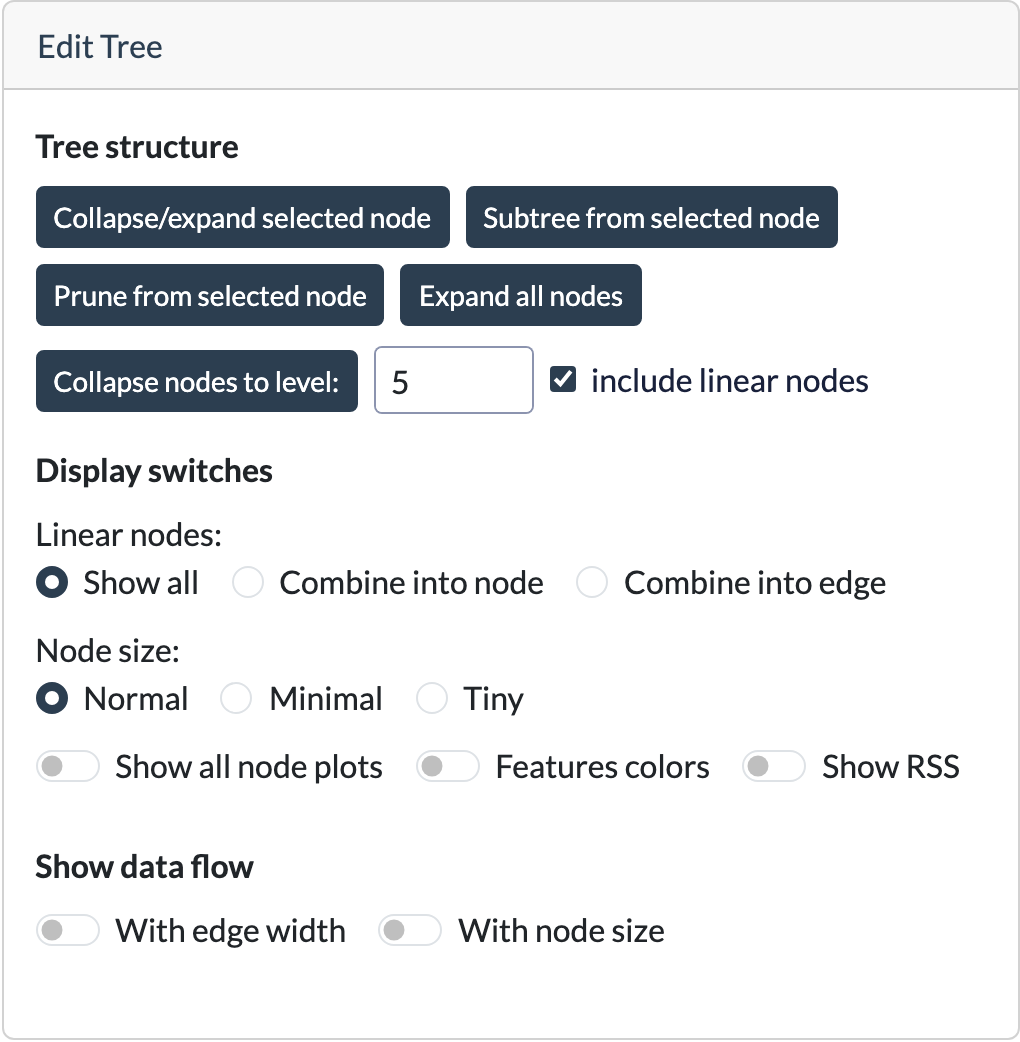
Tree structure
These buttons determine which parts of the tree are currently visible.
| Button | Description |
|---|---|
| Collapse/Expand selected node | Toggles whether the children of the currently selected internal node are visible. An internal or collapsed node must be selected. |
| Subtree from selected node | Look at the subtree rooted at the selected node. The rest of the tree is removed (and can be reloaded by using the reload tree button in new tree). An internal node must be selected. |
| Expand all nodes | Expands all previously collapsed nodes in the tree |
| Collapse nodes to level: N | Collapses the tree so that only the first N levels remain. When Include linear nodes is enabled (PILOT only), linear (non-splitting) nodes are also counted when determining the collapse level. |
Display switches
These controls change how the nodes and edges of the tree are displayed.
| Switch | Description |
|---|---|
| Linear nodes | Controls how chains of linear nodes are displayed in PILOT trees. Available options are Show all (each as its own node), Combine into node (merged into a single node), or Combine into edge (merged into the connecting edge). |
| Node size | Controls the size of the displayed nodes. Availible options are Normal (show full size with split information), Minimal (show smaller nodes with only feature information), or Tiny (nodes gets represented as colorded dots). |
| Show all node plots | Displays the node plot for every node simultaneously instead of only for the selected node. This can take some time for large trees or big datasets. |
| Feature colors | Colors nodes according to the feature associated with that node, rather than by node type. These colors are used consistently throughout the application, including in the node plots. |
| Show RSS | Displays the residual sum of squares (RSS) in the label of every node. |
| Show data flow with edge width | Adjust the thickness of the edges to show the number of datapoints that go trough that edge. |
| Show data flow with node size | Adjust the size of the node to show the number of datapoints that are in that node. |
Some combinations of options are not possible, which is adjusted for automatically.