Interface Overview
This page give a short orientation of the full application.
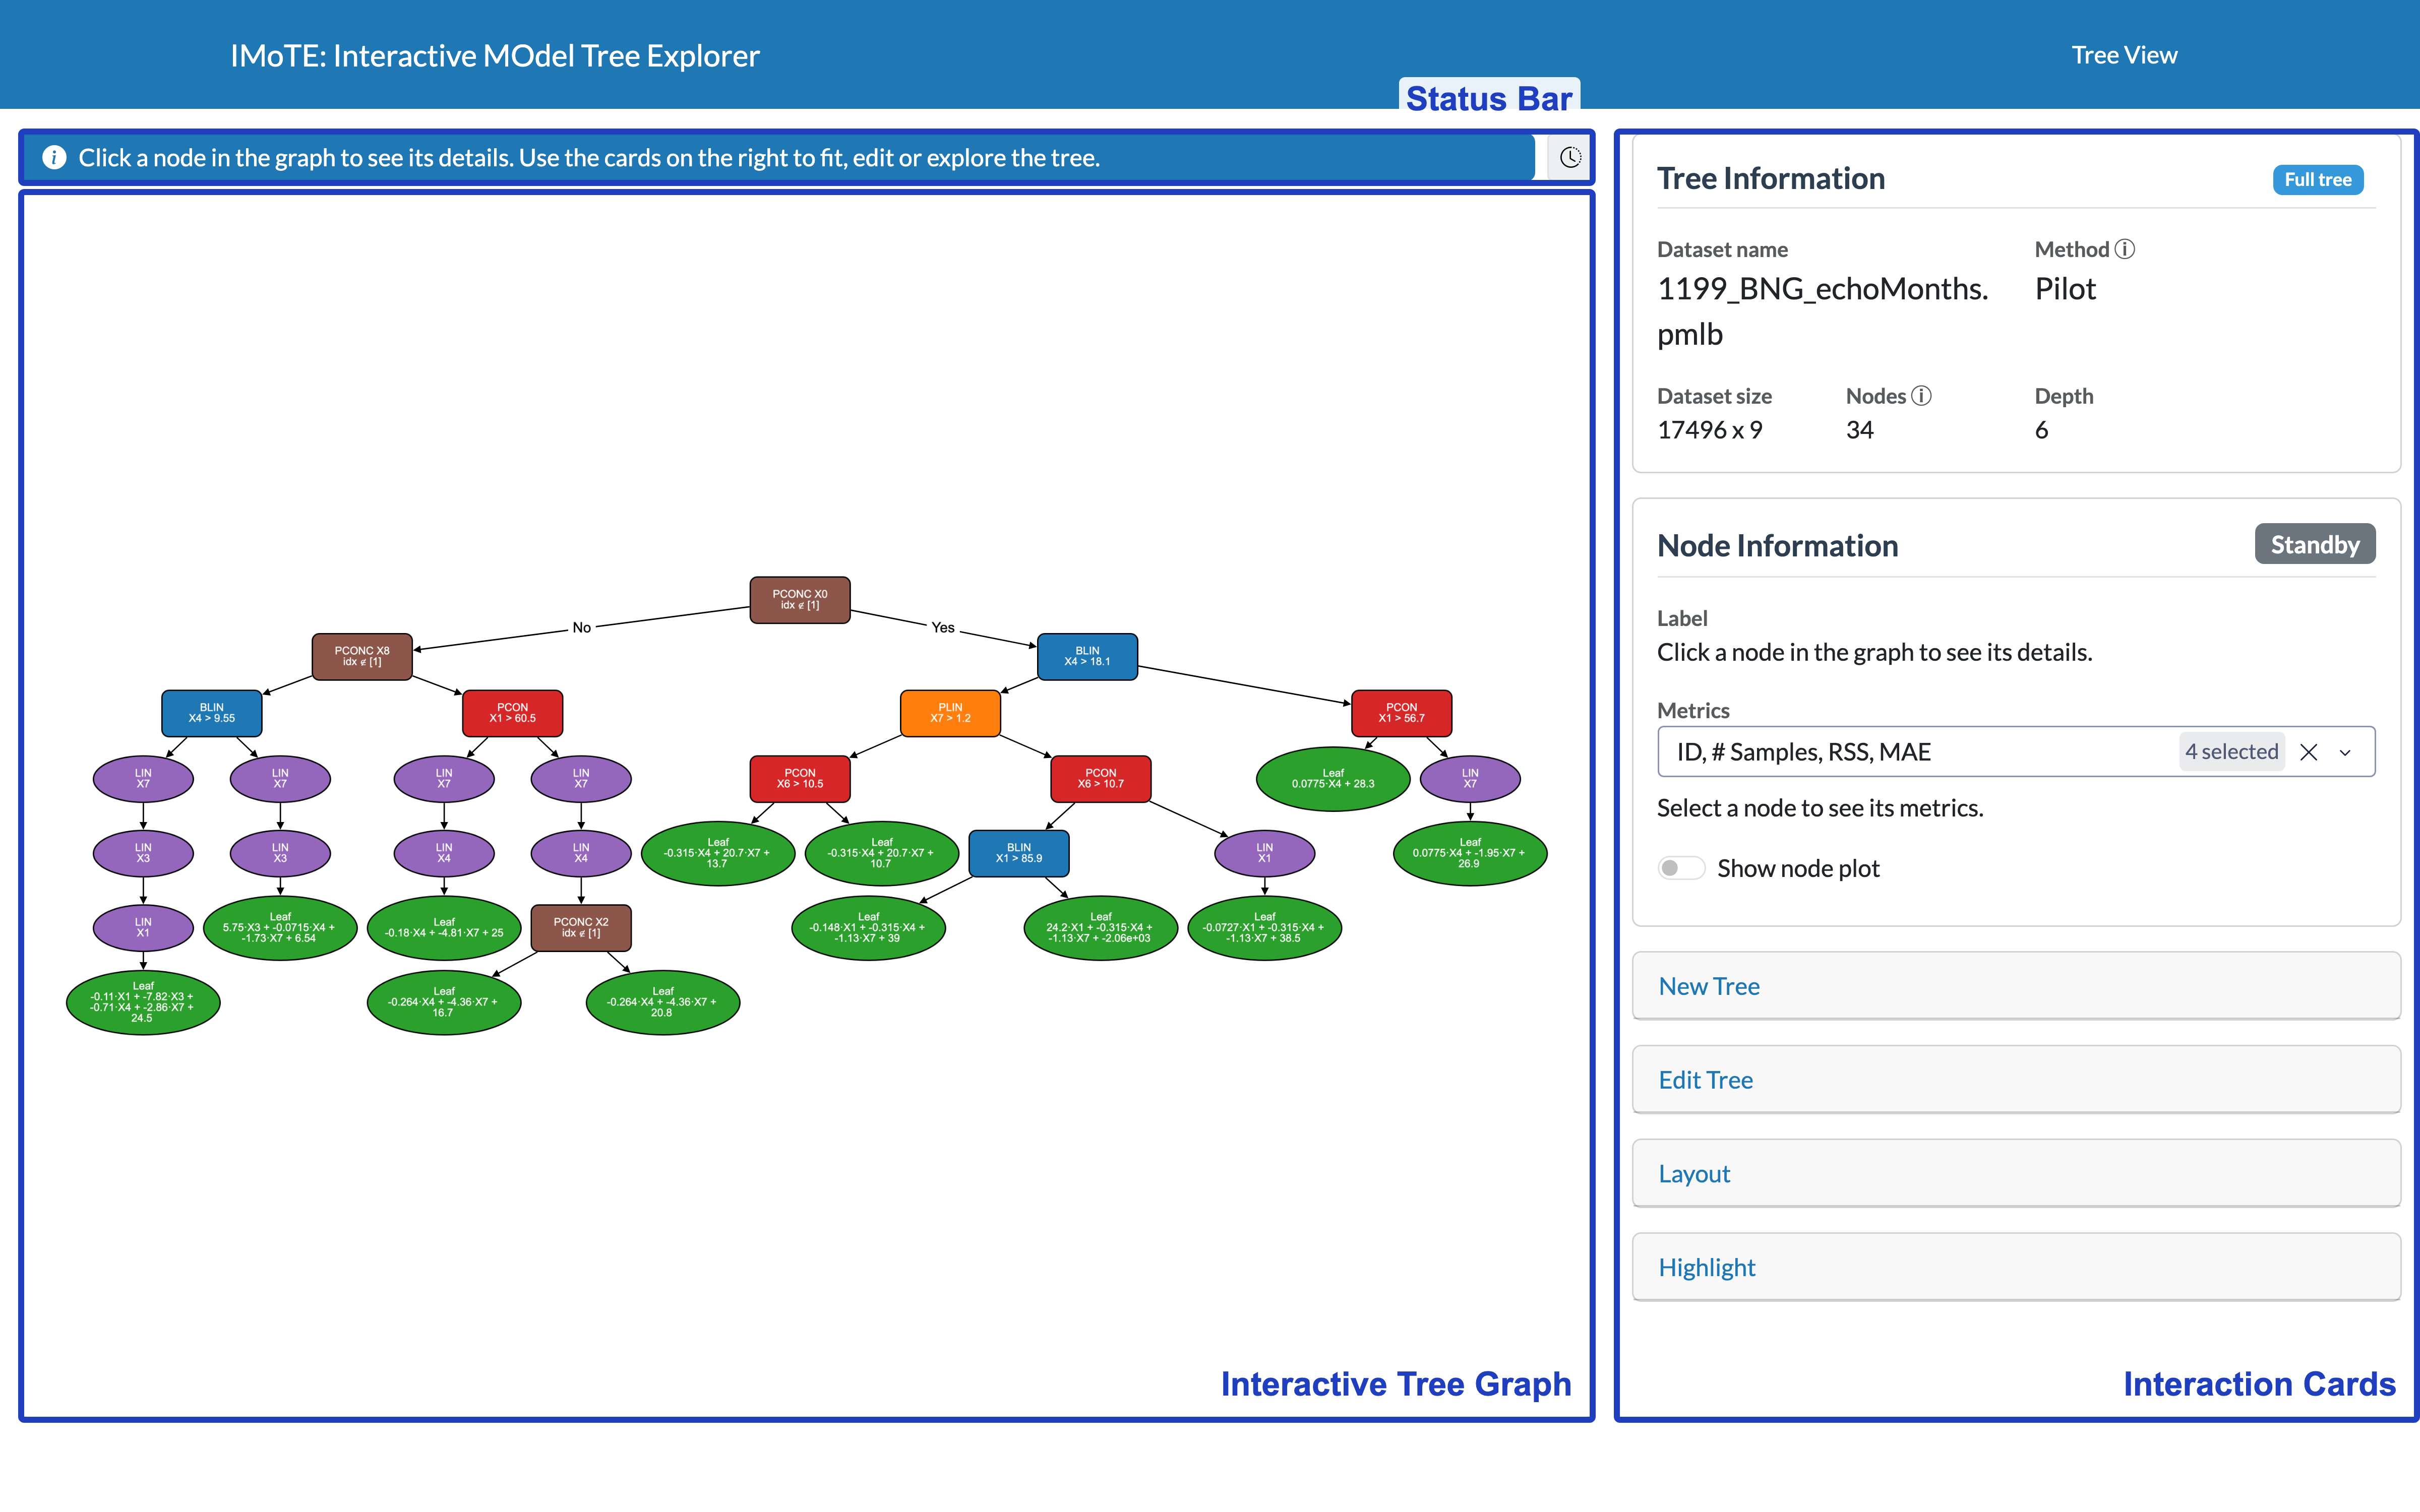
Layout
The app window is split into four main areas:
- The status bar, directly above the graph, tells you what happened after each action and can show you the history of all messages.
- The interactive tree graph, showing the current tree as an interactive Cytoscape graph. You can pan, zoom and click on or shift nodes.
- The interaction cards, containing a stack of (collapsible) interaction cards, each controlling or adjusting a different aspect the graph on the left of the stack.
Interaction cards
The first two cards — Tree Information and Node Information — are always visible, the other cards can expanded or collapsed by clicking their header
| Interaction Card | Purpose |
|---|---|
| Tree Information | Summary of the currently loaded tree |
| Node Information | Details and diagnostic plots for the currently selected node |
| New Tree | Fit a new tree, or save/load one |
| Edit Tree | Collapse, expand, and restyle the tree view |
| Layout | Control how the tree graph is laid out on screen |
| Highlight | Trace a specific data point's path through the tree |
Selecting a node
Clicking a node in the graph area is how you select it. The currenclty selected node is used by the Node Information card and is a requirmend for several actions in the Edit Tree card (e.g. "Collapse/expand selected node"). When a node is selected it has a yellow outline.