Highlight
The Highlight card lets you trace the path of a specific data point through the tree. This is useful for understanding exactly how the model arrives at a prediction for a particular observation.
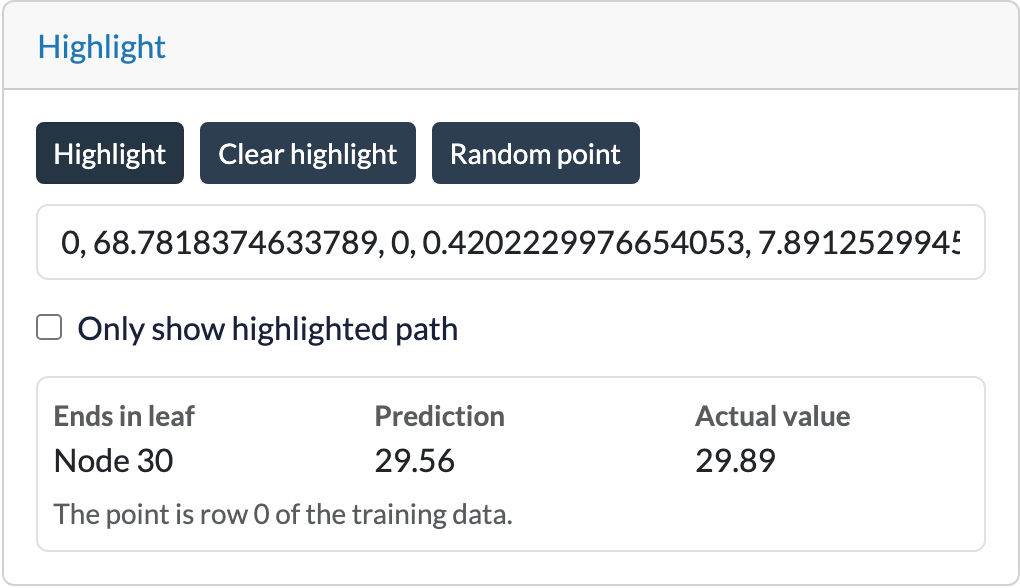
Highlighting a point
- Specify the data point to highlight:
- Enter the feature values as a comma-separated list (for example,
1.2, 0.5, 3.1,...). The number of values must match the number of features in the trees dataset. - Alternatively, click Random point to select a random training sample from the dataset.
- Enter the feature values as a comma-separated list (for example,
- Click Highlight. The path taken by the selected data point, from the root node to the predicting leaf, is highlighted in the tree.
- Optionally enable Only show highlighted path to hide all other branches. This can make the highlighted path much easier to follow, especially in large trees.
- Click Clear highlight to remove the highlight and return to the normal view.
The highlight is cleared when another tree is fitted, loaded or reloaded.
Result
Below the input, the card shows where the highlighted point ends up:
- Ends in leaf – The id of the leaf node the point ends in.
- Prediction – The prediction of the tree for the point, made by the linear model of that leaf.
- Actual value – When the point is a row of the training data (e.g. after Random point), its true target value. For other points this is "—".
Highlighting in subtrees
When viewing a subtree, the application always displays a highlighted path, even if the selected data point would not pass through that subtree in the original tree. This is a known limitation of the current implementation and should be taken into account when highlighting points in subtrees.